A B2B Sustainability Platform That Builds Trust Through Transparency

B2B
B2B
B2C
B2C
SaaS
SaaS
E-commerce
E-commerce
Sustainability
Sustainability

Oct 2023 - Feb 2025

Role: Product Designer

Grt-Intro
Grt-Intro

The Client Context & Business Objectives

Gratitude Co. is a branch company of the blockchain startup 3IPK. The company commissioned our team to develop a B2B2C SaaS platform — More-Gratitude — as part of a strategic move to occupy a niche in the growing market of sustainability and ethical e-commerce with a blockchain-based solution. And thus we came up with this platform that is aimed to help the sustainability-focused brands in communicating their business and product values in a transparent and trustworthy way to their customers.

  • The following business objectives were defined for each party:

  • Help B2B clients (sustainable brands) increase market exposure and revenue by building customer trust;

  • Provide B2C users (e-shop customers) with trustworthy and engaging sustainability data to support more informed buying decisions;

  • Establish Gratitude Co. as a trusted and reputable player in the growing market of sustainability and ethical e-commerce with scalable blockchain-backed solutions. Subsequently gain revenue from the expanded range of B2B clients through SaaS subscriptions.

Problem Statement

Many e-commerce customers are skeptical of vague “green” claims, and most brands lack the tools to communicate their values clearly and convincingly[↗]. Oftentimes the represented sustainability claims lack the proof behind them, verified in the form of third-party certificates, etc.. And when there is such proof documentation attached, often it is either too technical or too shallow, and its representation also lacks the engaging visual storytelling.

The Challenge

How might we help brands prove and personalize their sustainability efforts, in a way that builds trust, fits seamlessly into e-commerce, and gives them control over storytelling?

The Challenge

How might we help brands prove and personalize their sustainability efforts, in a way that builds trust, fits seamlessly into e-commerce, and gives them control over storytelling?

Solution

Design and deliver a web platform that enables e-commerce brands to showcase their values such as — transparent price details behind product cost, product’s traceable supply chain, or the verified sustainability claims — through an interactive widget that is integrated directly into their e-shop webpages, i.e. e-shop widgets. Another solution to represent these values to customers comes in a form of interactive digital stories behind the product’s QR-code, i.e. QR-code presentations.

The sustainability claims are verified by Gratitude stuff according to certification requirements. Subsequently these claims are recorded on blockchain and are presented as immutable data.

What We Delivered >

A set of features in the B2B tool that let our clients import their product catalogue, get their sustainability data verified and configure the B2C widget and presentations experiences.

A set of features in the B2B tool that let our clients import their product catalogue, get their sustainability data verified and configure the B2C widget and presentations experiences.

An intuitive and ergonomic interface for most straightforward and efficient task completion.

An intuitive and ergonomic interface for most straightforward and efficient task completion.

A set of e-shop widgets & QR-code presentations to provide B2C customers with most transparent and trustworthy sustainability data.

A set of e-shop widgets & QR-code presentations to provide B2C customers with most transparent and trustworthy sustainability data.

A back-office tool for Gratitude admins to manage the platform content and to handle and verify the client data.

A back-office tool for Gratitude admins to manage the platform content and to handle and verify the client data.

Partnering with Gratitude has significantly enhanced our ability to showcase our commitment to sustainability. Their verification widget provides clear, trustworthy proof of our values, setting us apart and building greater trust with our customers.

Andrej Chovan

CEO of Lebeddie

Partnering with Gratitude has significantly enhanced our ability to showcase our commitment to sustainability. Their verification widget provides clear, trustworthy proof of our values, setting us apart and building greater trust with our customers.

Andrej Chovan

CEO of Lebeddie

Results

0

5

paying B2B clients from 🇸🇰, 🇫🇮, 🇨🇾 by Jan 2025 from live product launch in Jul 2024

0

5

paying B2B clients from 🇸🇰, 🇫🇮, 🇨🇾 by Jan 2025 from live product launch in Jul 2024

30+

client submissions verified by Gratitude Admins within the first two months post-launch

30+

client submissions verified by Gratitude Admins within the first two months post-launch

Grt-dashboard
Grt-dashboard

My Role & Responsibilities

As the sole Product Designer, I led the end-to-end design across the entire platform, shaping both internal B2B tools and B2C experiences.

  • Designed and iterated all core features (Claims, PT, SCT, Presentations) and interface patterns across the B2B tool for 2 user roles — our B2B Clients and Gratitude Admin;

  • Outlined the configurable B2C experiences: e-shop widgets and QR-code presentations;

  • Built a design system and UI logic from scratch;

  • Worked closely with the development team to align implementation and the logic behind user interface processes, taking into account the tech constraints;

  • Partnered with management, sales and dev on problem-solving sessions and to prioritize roadmap based on real client usage and needs;

Project Team: a Development team (Ruby on Rails, Tailwind), a Graphic/Marketing/UI Designer (also responsible for the Gratitude landing webpage), a Project Manager, a Sales/Marketing team including the Sales and Strategy Lead.

The work on this project followed iterative processes within an agile environment — collaboratively implementing feature by feature across design, development, and strategy.

UX Strategy & Research

The Challenge

Instead of traditional user interviews or usability testing (which weren’t feasible at that stage in our startup environment), I focused on a lean UX approach, defined by competitor analysis and client feedback.

The Challenge

Instead of traditional user interviews or usability testing (which weren’t feasible at that stage in our startup environment), I focused on a lean UX approach, defined by competitor analysis and client feedback.

Competitor analysis of direct and adjacent sustainability tools to assess how sustainability data was structured, visually represented, and embedded into e-commerce.

Competitor analysis of direct and adjacent sustainability tools to assess how sustainability data was structured, visually represented, and embedded into e-commerce.

This helped inform the design of our widget and product presentation logic.

This helped inform the design of our widget and product presentation logic.

Client feedback loops: While early designs were based on hypotheses and industry standards, we validated them through demo sessions and follow-ups with real clients.

Client feedback loops: While early designs were based on hypotheses and industry standards, we validated them through demo sessions and follow-ups with real clients.

Their input led to several refinements — such as varying widget sizes for different e-shop layouts and streamlining document uploads.

Their input led to several refinements — such as varying widget sizes for different e-shop layouts and streamlining document uploads.

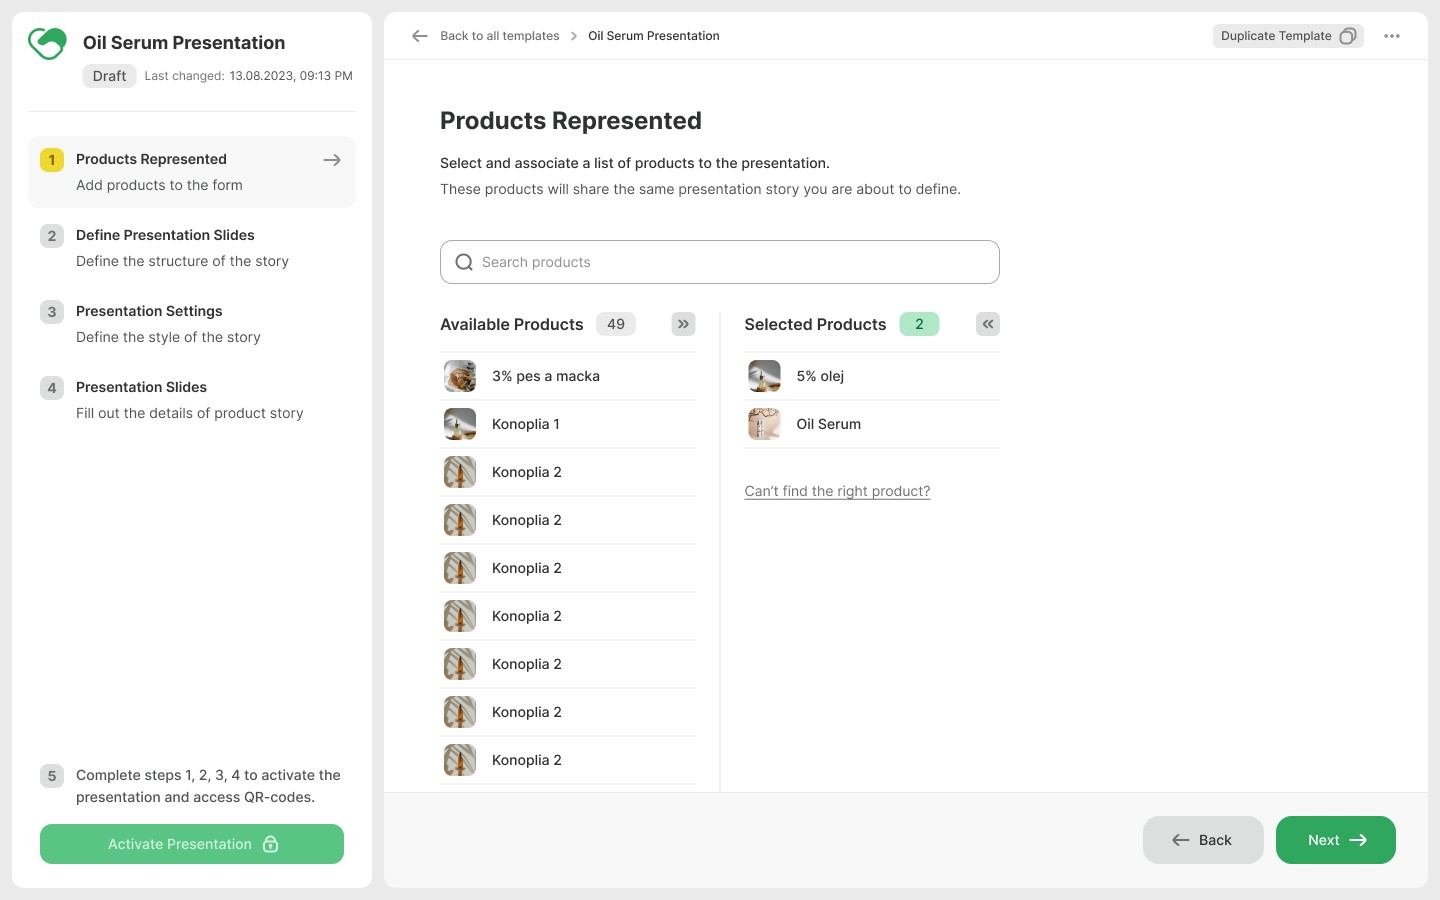
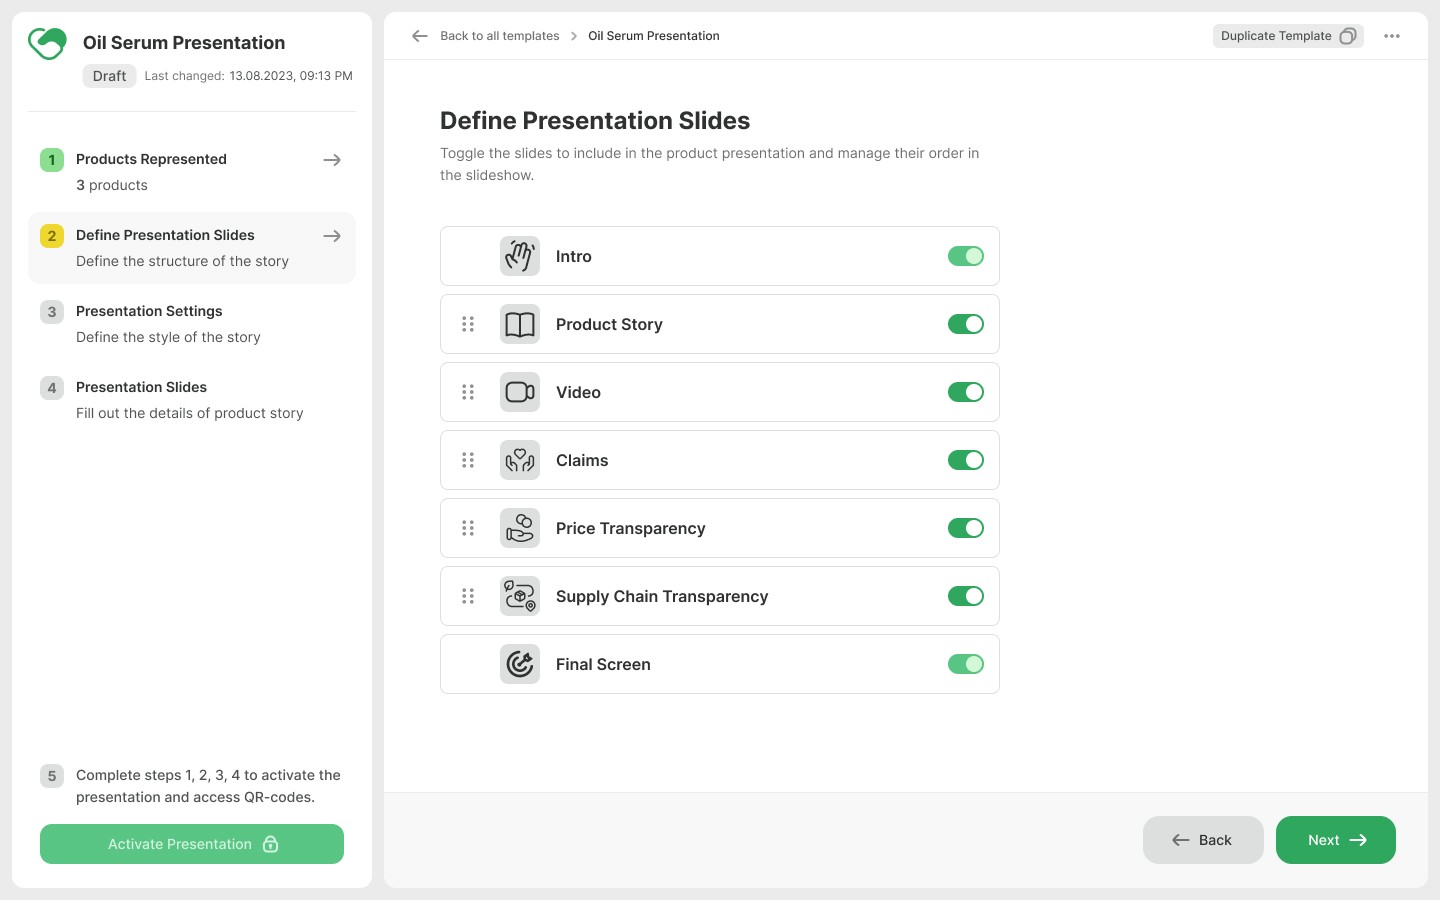
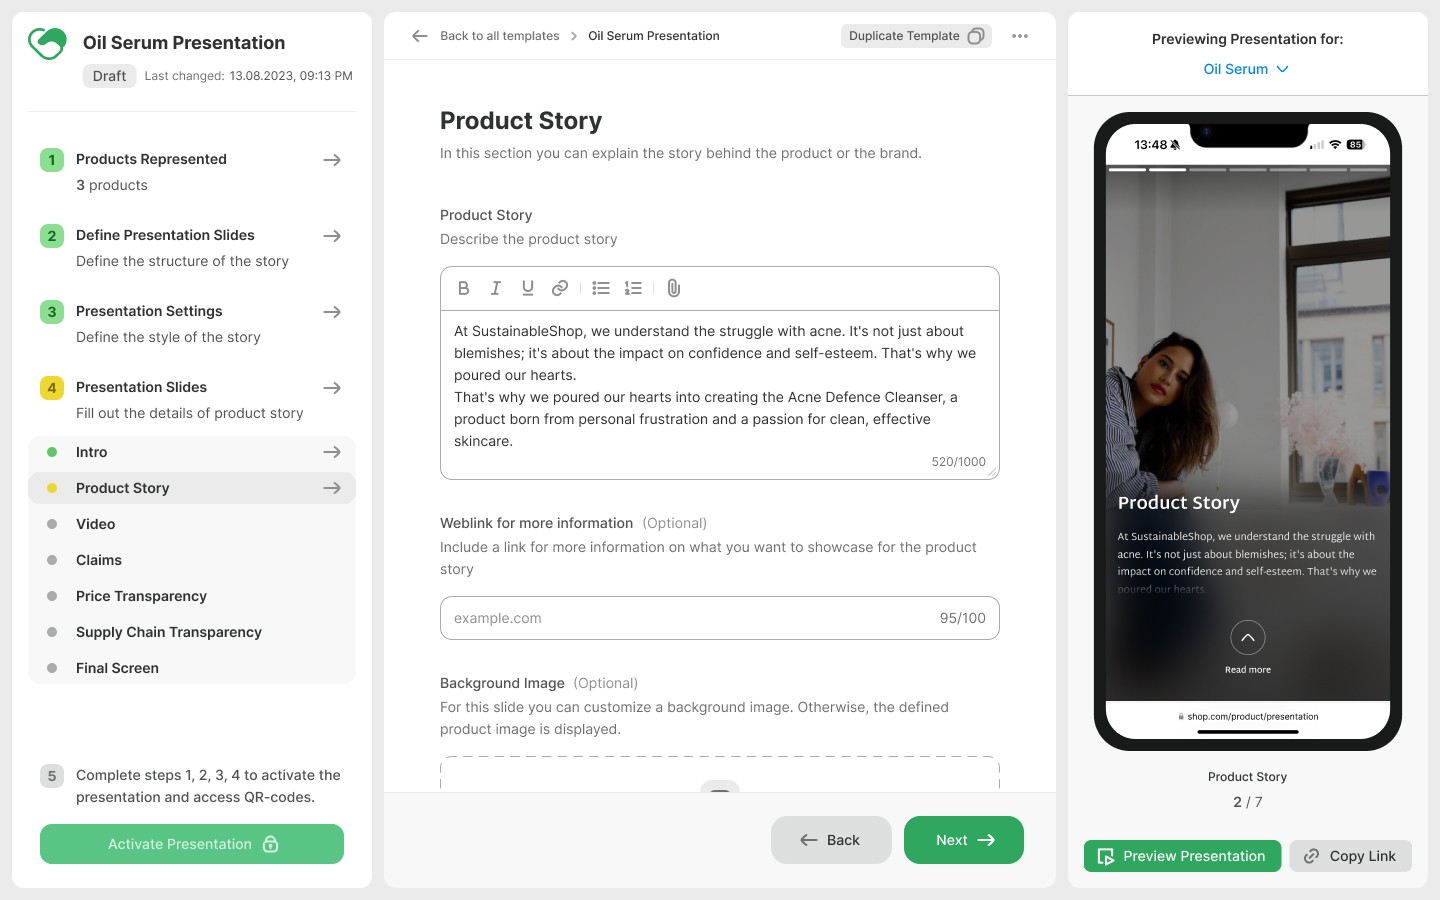
Information Architecture

Based on initial ideation, requirements and collected research insights, I came up with an information architecture for the B2B platform, covering B2B Admin and Gratitude Admin user roles.

B2B Admin (our client) imports their product catalogue and manages it, defines claims for their business needs, sends claim submission for review, configures the Price Transparency and Supply Chain Transparency, and shapes the e-shop widget and QR-code presentations.

Gratitude Admin onboards the client, reviews their claim submission, can manage client data, maintains platform content.

Claim Verification & Display

Sustainable brands need a fast, guided way to prepare and get their sustainability claims verified — and have them displayed transparently on webpages of their products. That means a clear way of associating claims with products and understanding the requirements for the proof documentation that needs to be uploaded to substantiate claims.

Add Claim

The client browses a curated list of claims relevant to their industry, with a preview of each in the side panel. Search and filter options help them find the right claim instantly.

Define Submission

Once a claim is selected, the client will need to upload the proof documentation for it within a claim submission, which subsequently gets reviewed by Gratitude Admin. Thus, the user proceeds to the first step of the wizard - selects a claim level and reads the requirements that the documentation must meet for that claim.

Document Upload

The client uploads proof (e.g. certificates, reports), and leaves an explaining message for customers. Interface indicators show submission completeness and allow flexible editing.

Associate Products

Lastly, the client selects products from their catalogue, with support for bulk selection, easy filtering and searching. This links claims to these products, and these claims will be shown in the e-shop widget.

Submission Review

Clients can track all submissions at a glance — see draft or review status, expiration dates, and which products are covered. Notifications keep them informed as submissions are verified.

  • Clients can submit a new claim in under 10 minutes — from selection to submission.

  • Clients can submit a new claim in under 10 minutes — from selection to submission.

  • Time-saving features like submission duplication and product reassignment reduce repetitive work, especially for similar submissions or renewals of expiring ones.

  • Time-saving features like submission duplication and product reassignment reduce repetitive work, especially for similar submissions or renewals of expiring ones.

  • The process eliminates to the maximum extent the need for support requests.

  • The process eliminates to the maximum extent the need for support requests.

The Widget behaviour in desktop and mobile browsers displaying sustainability claims

Once the claim is reviewed and approved by Gratitude Admin, it becomes instantly visible in the product’s interactive widget on the client’s e-shop.

  • When an e-shop customer clicks the widget, they can see:

    • The claim’s description and the client’s message;

    • The attached verified document as a proof;

    • Additional proof in a form of blockchain record (immutable data);

If multiple claims are shown, their order of priority is configurable by the B2B Admin, as well as the widget size. It is optimized for desktop and mobile views.

  • Customers understand sustainability claims instantly, without needing to read PDFs or search elsewhere.

  • Customers understand sustainability claims instantly, without needing to read PDFs or search elsewhere.

  • Having the proof at hands, claims can inform the customer at more conscious shopping decisions.

  • Having the proof at hands, claims can inform the customer at more conscious shopping decisions.

  • Various widget sizes and layouts ensure seamless integration with different e-shop designs.

  • Various widget sizes and layouts ensure seamless integration with different e-shop designs.

Price & Supply Chain Transparency

Sustainable brands often struggle to present their product journey and cost breakdown in a way that’s both trustworthy and easy to digest for customers.

Inside the Gratitude platform, clients can define Price Transparency (PT) and Supply Chain Transparency (SCT) for each product. These two modules are closely linked in both UX and logic — and are designed to make data input intuitive and updates efficient even for non-technical users.

PT - Defining Cost Structure

The client manages which cost categories reflect their product’s pricing logic. The client can define their own custom cost categories out of list.

PT - Specifying Cost Breakdown

Brands assign percentages to cost categories, in case of need can arrange of their display order in widget by drag and dropping. The compact layout minimizes scrolling, while inline validation prevents errors before saving.

SCT - Defining Supply Chain Steps

The client chooses which steps reflect their product journey. The standard steps are pre-selected to save user’s time, as most likely, they are to be included in supply chain journey. And client can define the custom possible steps and position them within the chain.

SCT - Specifying details per Step

Each step supports multiple items, with inline document upload and location entry. Grouped inputs and collapsible sections keep the interface uncluttered even for complex supply chains.

PT- Defining Cost Structure

The client manages which cost categories reflect their product’s pricing logic. The client can define their own custom cost categories out of list.

PT - Specifying Cost Breakdown

Brands assign percentages to cost categories, in case of need can arrange of their display order in widget by drag and dropping. The compact layout minimizes scrolling, while inline validation prevents errors before saving.

SCT - Defining Supply Chain Steps

The client chooses which steps reflect their product journey. The standard steps are pre-selected to save user’s time, as most likely, they are to be included in supply chain journey. And client can define the custom possible steps and position them within the chain.

SCT - Specifying details per Step

Each step supports multiple items, with inline document upload and location entry. Grouped inputs and collapsible sections keep the interface uncluttered even for complex supply chains.

  • Re-using the filled-out forms as templates - massive time saver.

  • Re-using the filled-out forms as templates - massive time saver.

  • Automatic data validation eliminates user errors.

  • Automatic data validation eliminates user errors.

  • The interface patterns for both features are similar. That sped up the development of the platform, and users save time by going through familiar workflows.

  • The interface patterns for both features are similar. That sped up the development of the platform, and users save time by going through familiar workflows.

The Widget behaviour in desktop and mobile browsers displaying Supply Chain and Price Transparency respectively

Price Transparency: Customers instantly see where their money goes with a pie chart graph and percentage breakdown with additional descriptions.

Traceable Journeys: Every step from raw materials to shop is on display — complete with names, location origins, suppliers, document and links. In case of large number of items or large chunks of information, these are collapsed and can be instantly viewed by expanding.

  • Faster understanding, higher trust: Visual breakdowns of price and supply chain make complex data digestible in seconds.

  • Faster understanding, higher trust: Visual breakdowns of price and supply chain make complex data digestible in seconds.

Presentation Configurator & QR-Code Stories

Product packaging and labels have limited space — they can only fit short claims or certification logos, leaving most sustainability data unseen. For brands that invest heavily in transparency, this means their efforts are often hidden.

By adding a product-specific QR code that opens an interactive, mobile-friendly presentation, shoppers can quickly see the full picture: where the product came from, how it was made, and why it’s a better choice. In a store, that extra context can be one of deciding factors that drives a purchase.

Choose Products for the Presentation

Brands start by selecting a range of products that will share the identical story. The principle is the same as selecting products within submissions and PT, SCT.

Defining Story Strcuture

Then the client chooses which sections will be displayed in their product story. By default all standard sections are pre-selected and are positioned in the presumable right order with the possibility to reorder them - that saves the user time.

Fill out the Story and Live Preview

Section by section client customises the information and uploads media (optimal for mobile layouts), while having a live preview of the presentation in the right sidebar per each of represented products.

Access the QR-Code

Once configured, the tool automatically generates a product-specific QR code, ready for packaging or marketing materials. The QR code links directly to the mobile-first presentation.

  • Effortless Storytelling: Non-designers can create engaging, mobile-ready product stories in under 10 minutes (layout is already pre-defined and most of the data pre-fetched).

  • Effortless Storytelling: Non-designers can create engaging, mobile-ready product stories in under 10 minutes (layout is already pre-defined and most of the data pre-fetched).

  • Visual Brand Consistency: Pre-built templates ensure a unified brand voice across all product presentations, without losing flexibility for minor adjustments.

  • Visual Brand Consistency: Pre-built templates ensure a unified brand voice across all product presentations, without losing flexibility for minor adjustments.

  • Reduced Marketing Workload: Instead of spending a lot of time on custom solutions, brands can use our tool and save the time for their business activities.

  • Reduced Marketing Workload: Instead of spending a lot of time on custom solutions, brands can use our tool and save the time for their business activities.

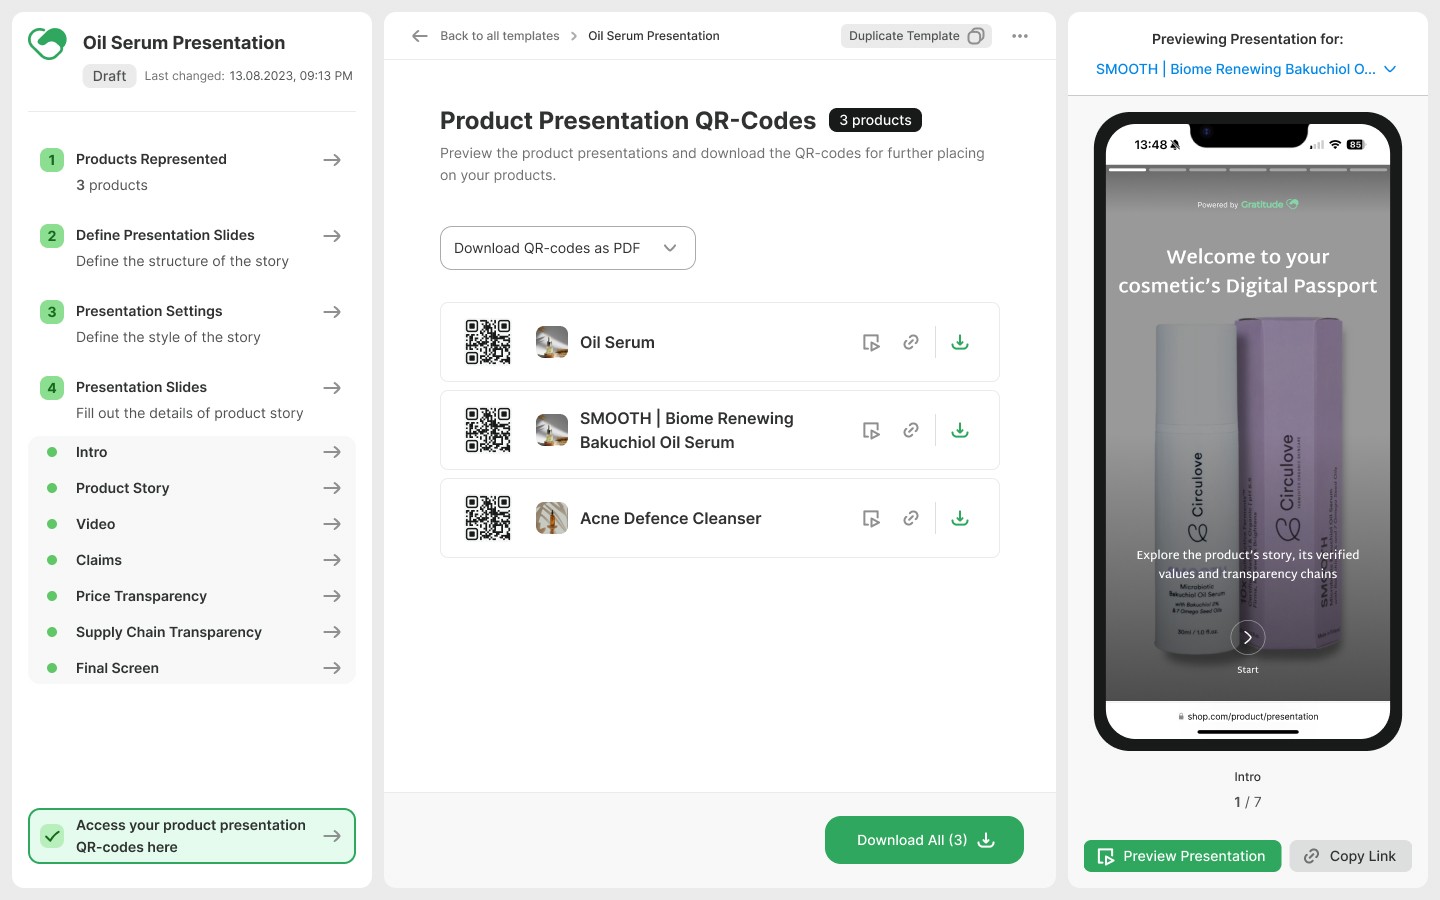
The QR-code product presentation in action

The customer scans the QR-code and an intuitive Instagram-like story opens: splash intro, product/brand story, video explaining the product/brand, a list of claims with details on expand, product’s price and supply chain breakdown. At the end of the journey user can leave feedback by rating the experience and then either visit by link the product’s e-shop webpage or share the story.

The interface is adaptable to any modern smartphone layout: from largest iPhones to smallest 320px iPhone SE.

  • Customers scan and an have an instant access into the product story without downloads or logins.

  • Customers scan and an have an instant access into the product story without downloads or logins.

  • The whole story can be watched within a minute or five, depending on content. The smooth transitions, familiarity of Instagram-like experience and value of information keep the user engaged.

  • The whole story can be watched within a minute or five, depending on content. The smooth transitions, familiarity of Instagram-like experience and value of information keep the user engaged.

  • Presentations have the room for new future features such as life-cycle assessment, product care tips, or related product highlights, as well as more visual customisation.

  • Presentations have the room for new future features such as life-cycle assessment, product care tips, or related product highlights, as well as more visual customisation.

Style & Component Guide

A short notice: the design system was built from scratch and maintained for further design iterations.

Grt-designsystem
Grt-designsystem

Measuring Success

Important Note

In February 2025 Gratitude Co. faced severe lack of investments, the whole project halted at this stage.

Important Note

In February 2025 Gratitude Co. faced severe lack of investments, the whole project halted at this stage.

Although formal analytics tools weren’t implemented during the MVP stage, the platform was designed with clear points for measuring adoption and impact:

  • 17 secaverage time customers spent interacting with the widget (early engagement metric);

  • Widget engagement rate — % of product page visitors in e-shop who opened the widget;

  • QR scan rate — number of customers scanning product QR-codes in-store;

  • Feedback review — how many customers found the widget / presentation experiences valuable or not valuable, and how many does not give any feedback at all.

  • Proof document open rate — measuring trust-building behavior;

  • Feature adoption — 4 early clients integrated Claims, PT, and/or SCT; 2 also prepared QR presentations (though not yet rolled out on packaging).

These metrics would guide product iteration, highlight ROI for clients, and validate the platform’s role in influencing sustainable purchasing behavior.

Results & Key Takeaways

1

A live product launch with 5 paying clients from 🇸🇰, 🇫🇮, 🇨🇾 by Jan 2025. 4 of them integrated our features into their business.

1

A live product launch with 5 paying clients from 🇸🇰, 🇫🇮, 🇨🇾 by Jan 2025. 4 of them integrated our features into their business.

2

Positive feedback from the clients regarding not only the final product — e-shop widgets & QR-code presentations, — but also the intuitive and not time-consuming workflow behind the platform.

2

Positive feedback from the clients regarding not only the final product — e-shop widgets & QR-code presentations, — but also the intuitive and not time-consuming workflow behind the platform.

3

A competitive product with potential scaling to the wider EU market, both in terms of B2B brands and their customers.

3

A competitive product with potential scaling to the wider EU market, both in terms of B2B brands and their customers.

This project showed me how tightly-aligned business requirements, a clear UX vision, and consistent iteration can produce a product that serves both operational efficiency and customer engagement — even in the lean, high-pressure environment of a startup.

We are real business and customers, who are looking for natural, effective skin care on our website, can spot more-gratitude icon, which helps in customer’s decision making as part of the purchasing process and journey on our website.

Timo Salomäki

Founder of Circulove

We are real business and customers, who are looking for natural, effective skin care on our website, can spot more-gratitude icon, which helps in customer’s decision making as part of the purchasing process and journey on our website.

Timo Salomäki

Founder of Circulove

Next Steps

If development continued, high-impact improvements could include:

  • AI-powered translations — automatically localize claim descriptions and proof summaries for multilingual audiences.

  • Dashboard implementation — give B2B clients insight into widget/QR engagement, helping them optimize sustainability storytelling.

  • Future feature branches — integration of life-cycle assessment data, cross-selling sustainable products, and in-store tips for end customers.

  • More visual customisation for QR-code presentations — expand presentation templates with adjustable layouts, imagery, and branding elements.

  • Widget dark mode — adapt to darker e-shop themes without compromising legibility.

Serhii Klymenko

Updated: Sep 2025

Designed & Built in Framer

Serhii Klymenko

Updated: Sep 2025

Designed & Built in Framer